Dashboard
The OpenAdmin offers an administrator-level interface where you can efficiently handle tasks such as creating and managing users, setting up hosting plans, configuring backups, and editing OpenPanel settings.
The dashboard page is the hub of the Admin interface and provides the overview of the current server performance, services and usage.
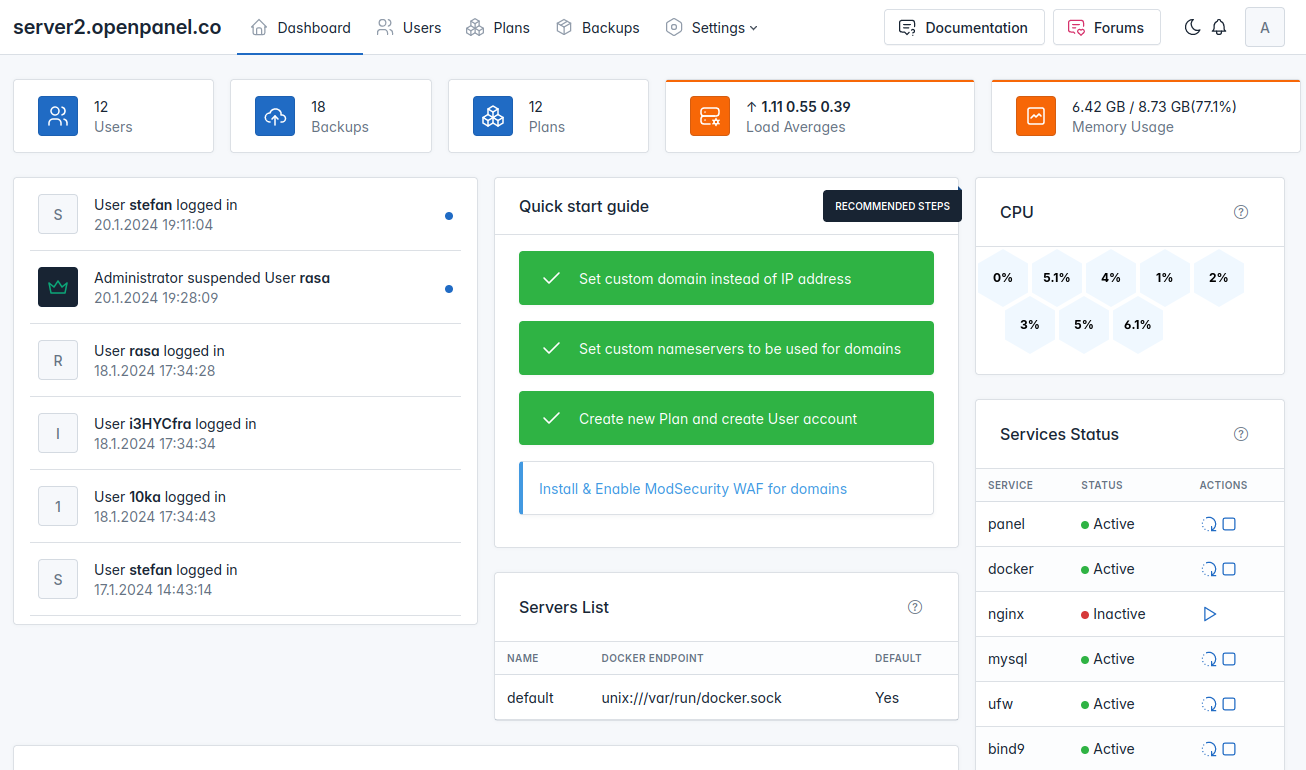
On top of the pages, you can find the header that contains:
- Server name: If brand name is set, display brand name; otherwise, show server IP address.
- Menu to access the Users, Plans, Backups, and Settings pages.
- Links to the official Documentation and our Community Forums.
- Dark mode toggle: Allows you to switch between dark and light modes.
- Notifications indicator: Displays important server-wide alerts.
- Avatar: Indicates the admin username with options to edit the profile.
The dashboard page contains 10 widgets:
- User widget: Displays the total number of user accounts.
- Backups widget: Shows the number of backup jobs and indicates backup errors if any.
- Plans widget: Indicates the number of plans available.
- Load Averages widget: Presents real-time server load with color indicators.
- Memory Usage widget: Provides the current memory usage with color indicators.
- Activity widget: Exhibits the latest activities of users and the Administrator.
- Server list widget: Lists connected remote OpenPanel instances.
- CPU widget: Illustrates real-time usage for each CPU core with color indicators.
- Services status widget: Displays the status of relevant services and actions to control them.
- Disk usage widget: Presents server partitions and disk usage for each partition.
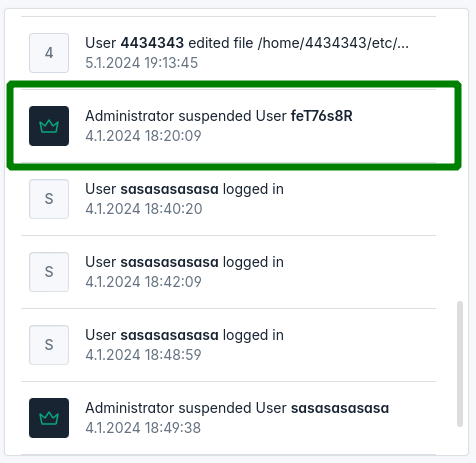
Activity
The OpenAdmin dashboard's activity widget shows a log of actions taken by OpenPanel users, with a focus on those performed by the Administrator. The log is organized from newest to oldest, and active users, who have taken actions in the last 30 minutes, are marked with a green dot on the right side. To view detailed activity information, click on the user icon (avatar) to open their user account page with the Activity tab.
Quick start guide
Quick start guide highlights the recommended steps for the Administrator to perform uppon installing OpenPanel.
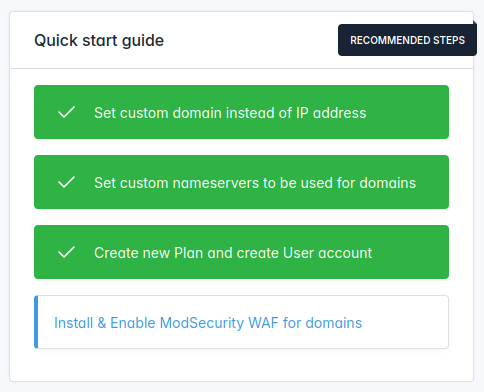
These steps include:
- Set domain name instead of IP address for accessing OpenPanel
- Create a hosting plan and create a user account
- Settings custom nameservers to be used for domains
- Install and configure ModSecurity WAF for Nginx
- Schedule remote backups
Server List
Note: This feature is still experimental and is not included in release versions, as it is not yet suitable for production.
The Server List shows the current Docker server and connected remote servers where OpenPanel is installed. Install OpenPanel on multiple servers and connect them to manage all from a single OpenAdmin interface.
CPU
The CPU usage percentage represents the amount of the CPU's processing power that is currently being utilized. It indicates how much of the CPU's capacity is in use at a specific moment. For example, a CPU usage of 50% means that the CPU is operating at half of its maximum processing capacity, while 100% usage indicates that the CPU is fully utilized, and there may be resource constraints or performance issues.
The data is auto-refreshed every 1 second to provide real-time updates.

Services Status
The Services Status widget displays a list of services managed by OpenPanel and enables you to check their current status, restart them, or start/stop when needed.
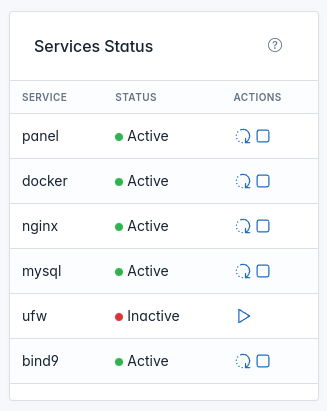
The Admin service is excluded from the list since stopping that service will disable the OpenAdmin interface. To disable the admin panel, use the 'Disable Admin Panel' option from Settings > OpenAdmin.
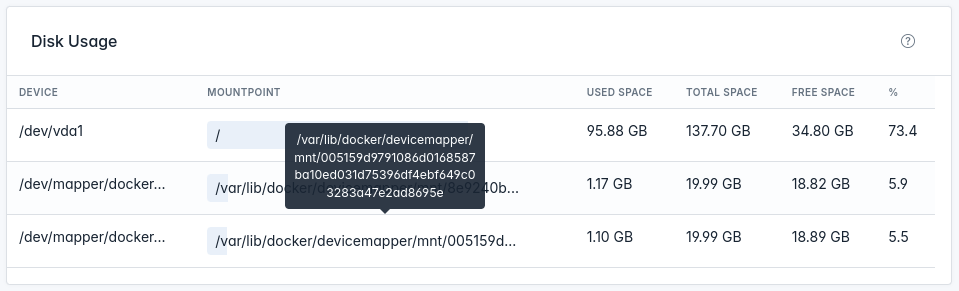
Disk Usage
The Disk Usage widget provides an overview of your system's disk usage. It displays information about each mounted disk partition, including details such as the device, mount point, filesystem type, and the amount of space used and available in a human-readable format (in gigabytes, GB or terabytes, TB). The 'Usage Percentage' column indicates the percentage of disk space currently in use.